Every fiber optic link loses some signal along the way. That's not a design flaw; it's just physics. But with approximately 1.2 billion kilometers of fiber optic cabling deployed each year globally,1 accounting for that loss is critical to ensuring your carefully planned infrastructure performs.
Understanding fiber loss – what causes it, how it's measured, and how to calculate it before you pull cable – is essential for anyone specifying or managing commercial fiber infrastructure. Here’s what you need to know.
What Are Fiber Optic Loss and Optical Fiber Attenuation?
Fiber optic loss, also called optical loss or optical fiber attenuation, refers to how much optical power is reduced as a signal travels through a fiber link. Light attenuates as it travels through glass, scatters at connection points, and bends around corners.
Optical loss is measured in decibels (dB), where a higher dB value indicates more signal loss. Attenuation is expressed as loss per unit of distance (dB/km) for the fiber cable itself, while individual components like connectors and splices are assigned fixed loss values per event.
dB loss in fiber is logarithmic, not linear. A 3 dB loss means half the optical power has been lost. A 10 dB loss means 90% of the power is gone. That’s why small differences in dB loss values have a disproportionate impact on whether a link works reliably – especially over long distances or with multiple loss contributors in series.
What Is dB Loss in Fiber Optics?
Knowing where fiber loss comes from can help you design links that stay within budget and troubleshoot links that don't perform as expected.
Attenuation varies by fiber type and operating wavelength. Here’s a breakdown:
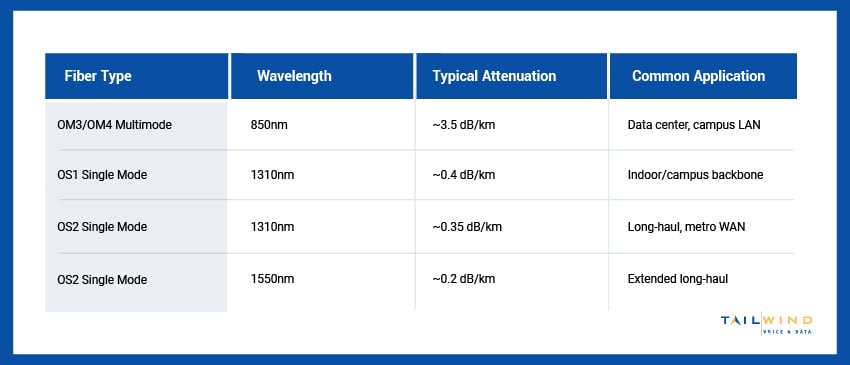
Single-mode fiber's dramatically lower attenuation per kilometer is the primary reason it's specified for any run where distance matters – backbone infrastructure, inter-building links, campus connectivity, and carrier WAN circuits.
How Does Connector Loss in Optical Fiber Contribute To Total Link Loss?
Connector losses in optical fiber are a fixed loss budget item. Every connector pair in a link adds loss, regardless of run length. The typical values are:
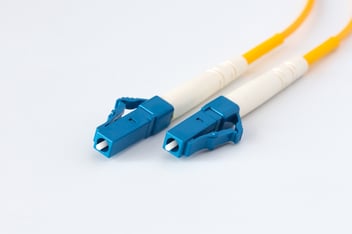
- LC/SC UPC Connector Pair: 0.3 dB, standard for most commercial installations
- LC/SC APC Connector Pair: 0.2 dB, better performance due to angled polish, used in RF and long-haul applications
- MPO/MTP Connector: 0.5–0.75 dB, higher loss due to multi-fiber alignment complexity
Fiber connector loss is one of the most controllable variables in a fiber deployment, provided there’s inspection and cleaning before every mating. For example, a properly cleaned LC connector pair will consistently perform near 0.1–0.2 dB, but a contaminated connector can introduce several dB of loss that pushes the link over budget.
Structured cabling installations that include post-termination insertion loss testing on every connector pair can also help, as a certified result proves the fiber connector loss is within spec – not just assumed to be.
Other Sources of Optical Loss in Fiber Networks
Several other factors beyond cable attenuation and connector loss contribute to total link loss, including:
Splice Loss
Fiber splice loss accumulates in long fiber runs requiring multiple cable sections, so it must be included in the link budget calculation.
Fusion splices, where the fiber ends are melted together, typically add 0.02–0.1 dB per splice. Mechanical splices, which align fibers using a mechanical fixture, add 0.1–0.5 dB and are generally used only for temporary repairs.
Bend Loss
Fiber loses signal when bent too tightly – the light can no longer be fully contained within the core by total internal reflection.
Macrobend loss occurs when fiber is routed around a corner radius smaller than its minimum bend radius specification (typically 10–15× the cable diameter). Microbend loss comes from small deformations caused by pinching, kinking, or improper cable management.
Both are preventable with proper installation practices.
Why Should You Measure Fiber Optic Loss in Installed Infrastructure?
Calculating expected loss before installation is an essential part of infrastructure planning. If your calculated link loss exceeds your transceiver's power budget, you'll know before pulling cable and can adjust your design – while discovering this problem post-deployment means rework, downtime, and lost productivity.
Measuring loss after installation is equally important. This figure confirms that the link is performing as designed and provides documented proof that installation quality meets specification. This testing also establishes a baseline for troubleshooting if problems develop later.
The two tools standard for verifying link performance in professional fiber certification are:
- OLTS (Optical Loss Test Set): Measures end-to-end insertion loss for the entire link. This is the primary certification measurement, so every run in a professional installation should have a documented OLTS result.
- OTDR (Optical Time-Domain Reflectometer): Sends a light pulse down the fiber and analyzes reflections to quantify individual loss events along the run. It identifies where loss is occurring, not just how much total loss exists.
Both measurements should be part of the documentation package delivered by any professional fiber cabling installer. TailWind’s structured cabling projects include OLTS and OTDR results as standard deliverables – giving you documented proof that every run meets spec, not just a verbal assurance.
How To Calculate Fiber Loss: The Link Budget Method
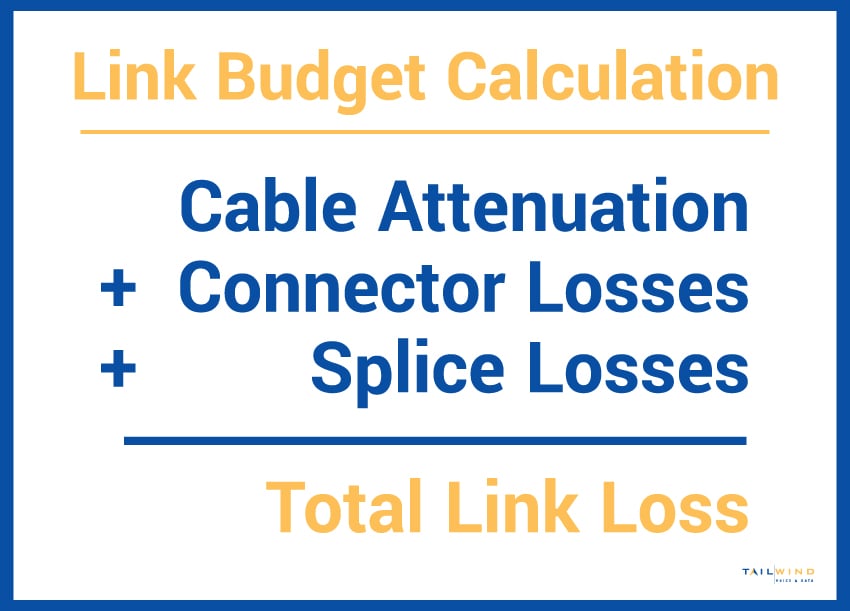
Calculating fiber loss before deployment tells you whether a planned link will work with your transceiver equipment. The process is called a link budget calculation. Here are the basic steps:
Step 1: Calculate Cable Attenuation
Multiply the fiber's attenuation coefficient (dB/km) by the run’s total length in kilometers.
Let’s say you’re implementing a 2 km campus backbone run with standard components. You've selected OS1 single-mode fiber, decided on four LC/SC UPC connector pairs, and planned two fusion splices where cable sections join.
For this step, you’d multiply the typical attenuation for OS1 single-mode fiber (0.4 dB/km) by 2 km.
0.4 dB/km × 2km = 0.8 dB
Step 2: Add Connector Losses
Multiply the number of connector pairs by the per-pair loss.
Continuing with our hypothetical scenario, you’re going to multiply the four connector pairs by the typical per-pair loss, which is 0.3 dB for LC/SC UPC connector pairs.
4 connector pairs × 0.3 dB = 1.2 dB
Step 3: Add Splice Losses
Multiply the number of splices by the per-splice loss.
Now, you would multiply the two splices by the typical per-splice loss, which ranges from 0.02 to 0.1 dB for fusion splices. We’ll use the upper limit here to be safe.
2 splices × 0.1 dB = 0.2 dB
Step 4: Sum Total Link Loss
Add the cable attenuation, connector loss, and splice loss values together to get the total link loss.
0.8 + 1.2 + 0.2 = 2.2 dB total link loss
Step 5: Compare to Power Budget
Check your transceiver's optical power budget, which is the transmit power minus receiver sensitivity. If the power budget exceeds the total link loss plus a safety margin (typically 3 dB), the link should work reliably.
In our example, 2.2 dB loss plus 3 dB margin means that 5.2 dB is required. If your transceiver's power budget is 10 dB, you have an adequate margin, and the link will work reliably. If the power budget is only 5 dB, the link doesn’t have enough margin and will perform unreliably or fail altogether.
Build a Better Fiber Infrastructure With TailWind
You have two paths with fiber loss: understand it and account for it before deployment, or discover its effects after your network goes live. One choice creates infrastructure that works. The other creates infrastructure that fails and must be redone.
At TailWind, our structured cabling experts have the technical knowledge and certified equipment to design links within budget, install them with proper connector management, and verify performance with comprehensive testing and documentation – so you get cabling that performs reliably across the entire lifespan of your network.
Get in touch today to get started.
Sources: